LookinMaine real estate monthly report.
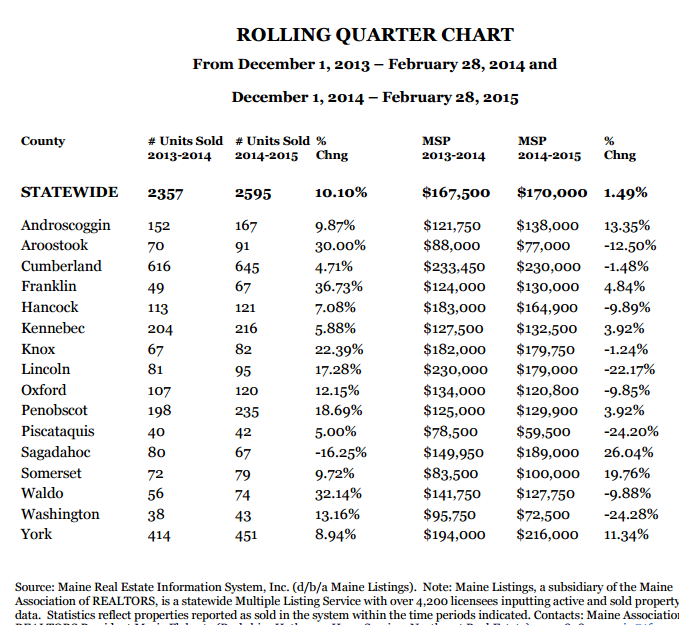
Lookin’ alive, Maine! The past quarter has seen a perkier market in all but one county. (‘Sup, Sagadahoc? I thought Bath Iron Works was on a hiring binge.)
The first three columns of that table address the number of houses sold this quarter versus the same quarter a year ago–it’s a measure of how easy (or hard) it is to get out from under a house you don’t want.
But the second three columns remind you that opportunity is not equal. These columns address any change in the average sale price, this quarter over the same quarter a year back. A big change in that average price can mean a couple things:
1: A big, expensive house sold, and its price is pushing the average around. Check the “volume” columns — a small volume of sales leaves the average price vulnerable to weirdo sales.
2: Sellers are SICK OF THIS AND GETTING OUT OF HERE EVEN IF WE TAKE A BATH ON THE PRICE! This might explain Lincoln County, where the number of sales is up, but the price is way down.
When you look at the populous counties (York, Cumberland, Kennebec) you find smaller swings from quarter to quarter: A high “n” (number of data points) produces a more reliable signal of where people are going.
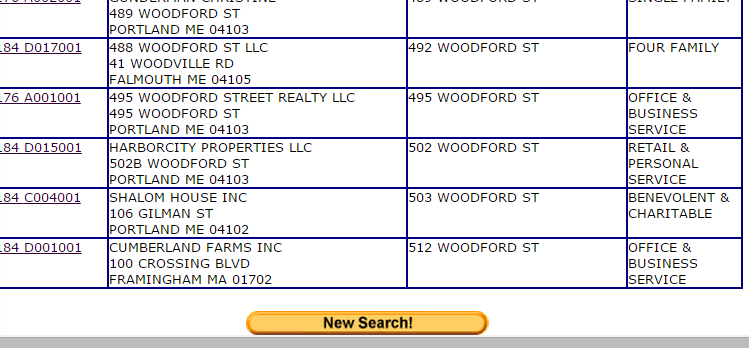

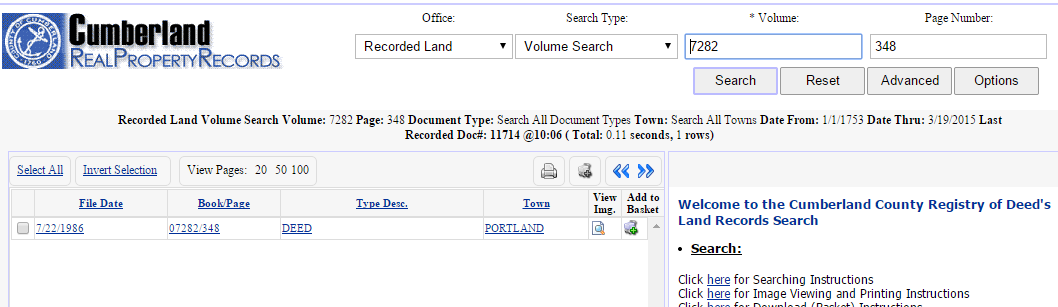
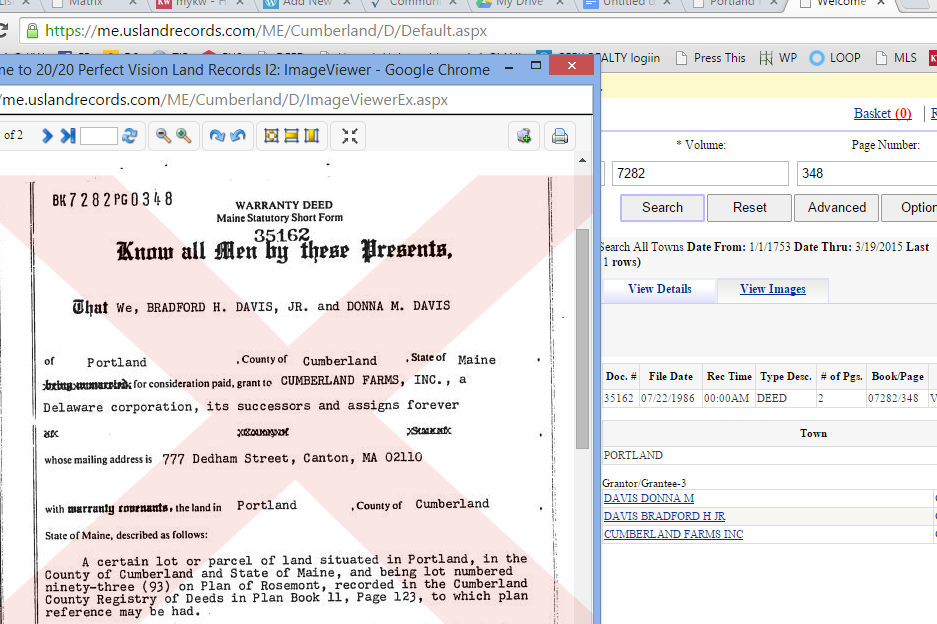
 numbers from the card. We’re going to find the deed for this property at the Registry of Deeds. Here’s