CITY LIVING MAKES YOU SMARTER

wikimedia [pd]

wikimedia [pd]

OK, that’s totally inflammatory and untrue. But new research again shows there’s something to the concept that animals with complex social lives need bigger brains: Your neighborhood, figuratively, determines your intelligence.

Now, this research wasn’t conducted on actual humans. The scientist studied 104 other species of group-living primates, tallying the rate of conflict between group territories for each species. And he tallied skull size, which can tell you something about brain size, which can tell you something about intelligence.

The primate species with the most conflict between neighboring territories had the biggest skulls. Ergo, perhaps: Keeping track of your friends and enemies requires a lot of brain power; those who excel at it are more likely to live–and breed. Thus social strife can cause fat heads to evolve.

Given our colossal cranium, our truly freakish  intelligence in the animal kingdom, it might be supposed that our species is particularly prone to inter-territorial conflict. Naaah, us? C’mon.

Now, perhaps you’re saying to yourself, “Antelope live in big groups and they’re not even as intelligent as gym socks.” There’s a difference between herd animals and social animals. Herd critters (antelopes and many other grazers) gang together mainly because it reduces their risk from predators. Social animals (elephants, humans, wild dogs) use their relationships to improve their performance in other areas–food gathering, child-rearing, home-building.

Anyway, it’s interesting how our species continues to create bigger and bigger territories, like cities, like nations. And how we continue to cop a bit of an attitude about anyone from “outside” whatever group we consider ours at any given moment. Perhaps we are still getting smarter.

MAINE REAL ESTATE QUARTERLY STATISTICS

Maine real estate monthly report.

LookinMaine real estate monthly report.

Lookin’ alive, Maine! The past quarter has seen a perkier market in all but one county. (‘Sup, Sagadahoc? I thought Bath Iron Works was on a hiring binge.)

The first three columns of that table address the number of houses sold this quarter versus the same quarter a year ago–it’s a measure of how easy (or hard) it is to get out from under a house you don’t want.

But the second three columns remind you that opportunity is not equal. These columns address any change in the average sale price, this quarter over the same quarter a year back. A big change in that average price can mean a couple things:

1: A big, expensive house sold, and its price is pushing the average around. Check the “volume” columns — a small volume of sales leaves the average price vulnerable to weirdo sales.

2: Sellers are SICK OF THIS AND GETTING OUT OF HERE EVEN IF WE TAKE A BATH ON THE PRICE! This  might explain Lincoln County, where the number of sales is up, but the price is way down.

When you look at the populous counties (York, Cumberland, Kennebec) you find smaller swings from quarter to quarter: A high “n” (number of data points) produces a more reliable signal of where people are going.


WHO OWNS THAT? REALTY SUPERPOWERS REVEALED!

When tax money flows between people and government, it often leaves a “public record,” a trail. You can use this public record to discover who owns a building. Realtors follow these trails for every house we handle, looking for back taxes, foreclosure motions, sibling squabbles, snarly divorces, and other afflictions.

To find your own trail, start at the Assessor’s Office in your town. Here’s Portland’s.

Input the street and/or street number you’re curious about. Screenshot (61) You’ll get a list of properties and tax accounts on that street; if you have the street number you’ll get just that property.Screenshot (62)

Click the account number at the left of the property you’re interested in, which will take you to that property’s “assessor’s card.” Cumby’s card, for instance, looks like this, and will contain allllll manner of info, including when it last changed hands, and for how much money. And a pretty picture, so you can be sure you’re looking at the right thing.

Screenshot (63)

Now write down the “Book and Page” Screenshot (64)
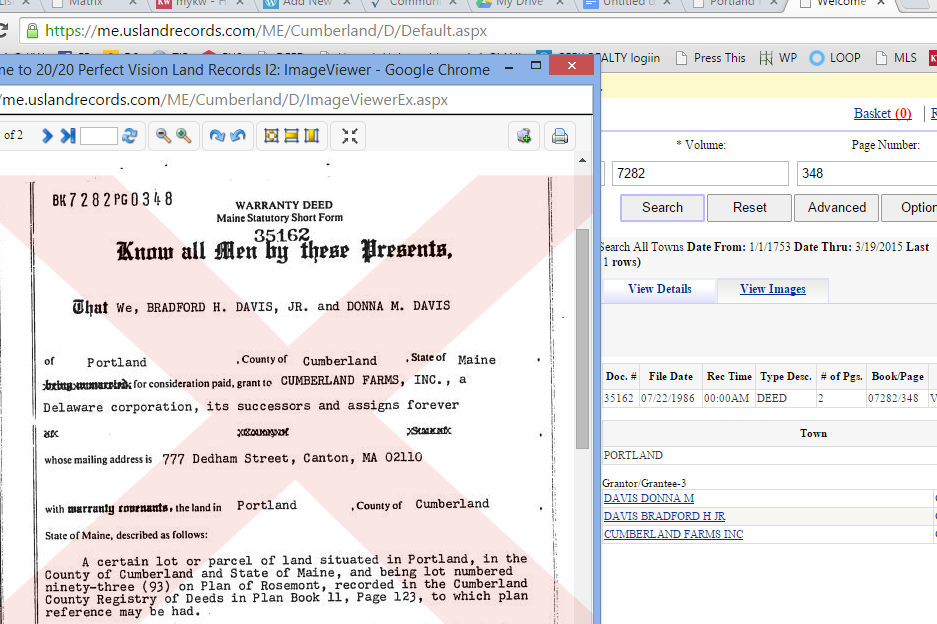
numbers from the card. We’re going to find the deed for this property at the Registry of Deeds. Here’s Cumberland County’s.

Search settings:

Office: Recorded Land

Search Type: Volume

Volume (Book): 7282

Page Number: 348Screenshot (65)

GO! Up comes the result list, from which you select that tiny magnifying glass image labeled, “View img.”

And voila. There’s the deed, the public record of the last time that property changed hands.

Screenshot (66)

It gets a lot funner than that, but also a lot more wordy. But just for fun, click one of those names that appears to the right of the deed…

HOUSE-STUFFING: HOW DO YOU RATE?

The Heritage Foundation, believe it or not.

The Heritage Foundation, believe it or not.

I was in an old mill-worker tenement building today, which got me thinking about the density of human shelter around the world. I covered this subject in THE WELL DRESSED APE, but am too cozy to venture into the frosty attic to retrieve the relevant research paper. So here is someone else’s graphic of how many square feet we humans inhabit, in various parts of the world.

How big is 65.5 square feet? One king-size bed plus a twin.


YOUNG PEOPLE ALL NESTY AND OPTIMSTIC: WHAT WENT WRONG?

Art: trulia

Art: trulia

I simply don’t know what to make of this. Every young person in America apparently wants to own a home. And very few older people do.

This Trulia survey of current renters suggests that the burning desire for ownership cools inexorably under the chill wind of age and experience. Or it suggests something else. I’m quite curious about it. But I’m most curious about these Millennials being all nesty and optimistic. It actually fits my experience with them as real estate clients.

These people were supposed to be sway-backed under the burden of debt, and dismal-eyed about their employment prospects. What went wrong? Well, they’re also considered a conscientious and idealistic batch of humans. And that’s what I see.

I’m excited about the communities they’re going to build.

HOME OWNERS, RENTERS, AND SQUEAKY WHEELS

Wikimedia [PD]

Wikimedia [PD]

It’s not uncommon for house-shoppers to steer clear of a neighborhood with a lot of renters. The perception is that renters “don’t care” about maintaining a safe and friendly neighborhood. Do they not care? Or do they not feel they have the right to care?

This little study demonstrates that, while renters are just as inconvenienced as owners are by  potholes, dead streetlights, and other degenerative diseases of a city, they are far less likely to complain about them.

Homeowners in Boston are three times more likely to file a complaint than renters, although renters outnumber owners two-to-one. And because 80% of the complaints address problems within two blocks of the citizen’s residence, the issues are likely to be the sort of things that impact renters and owners equally.

There is something magical about writing a property-tax check, I think. It feels like a direct purchase of city services, and entitles the homeowner to question the value of those services.

While renters most assuredly pay property taxes, they do so indirectly, handing the money to their landlords. Does that disconnect renters from their local government? That’s hard to say. But this study says that renters either don’t object to driving around potholes, or don’t believe anybody cares.